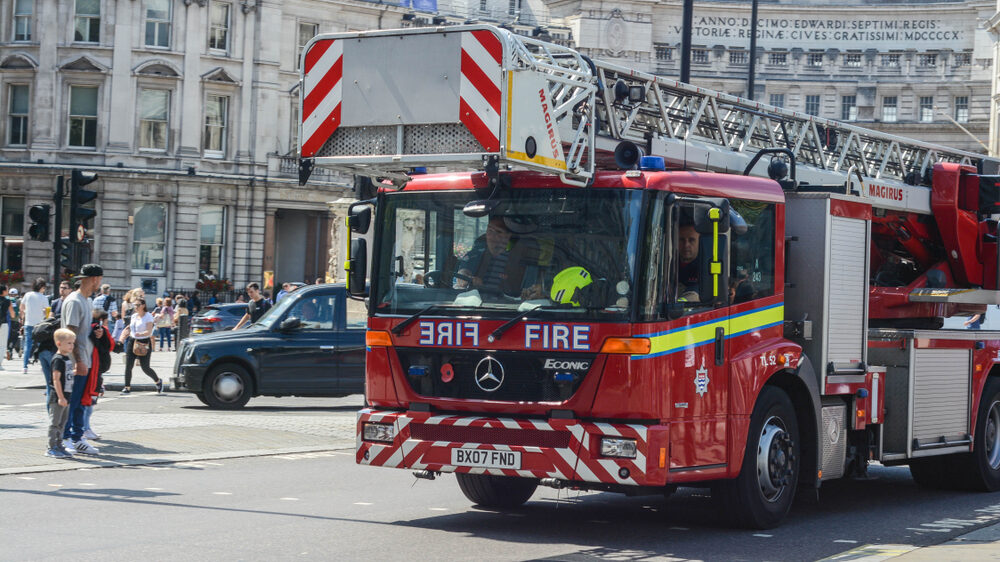
Response times to fires increase across England
- November 24, 2023
- 12:18 pm


Iain Hoey
Share this content
In a detailed analysis of fire and rescue services’ response times in England from April 2022 to March 2023, a concerning increase in response times was observed.
The data, drawing from various fire types and geographic locations, revealed a consistent trend of elongated response times, marking a notable shift in emergency service efficiency.
Primary fires: A rising concern
The average response time to primary fires was 9 minutes and 13 seconds, the longest since records began.
This marked a 23-second increase from the previous year. Notably, drive time, forming a significant part of the response, rose by 19 seconds to 6 minutes and 14 seconds.
Exclusion criteria for response time analysis
Certain incidents were excluded from the response time analysis.
These include abandoned road vehicle fires, fires in derelict properties, late calls where the fire was already extinguished, incidents with response times over an hour or less than a minute, and incidents with illogical event sequencing.
Varied increases across fire categories
All primary fire categories showed increased average response times compared to the previous year.
Primary outdoor fires witnessed the largest increase, by 1 minute and 12 seconds. Secondary fires also saw a notable increase of 34 seconds, resulting in an average response time of 9 minutes and 47 seconds.
Long-term trends in response times
Over the long term, response times to fires have shown a gradual increase since data collection began in 1995.
There was a decrease in 2021, attributed to reduced traffic volumes during the COVID-19 pandemic.
However, in the last two years, there has been a consistent rise in response times for both primary and dwelling fires, with secondary fires showing a slight fall in 2022 before rising again in 2023.
Detailed look at different fire types
- Primary fires: Increased to 9 minutes and 13 seconds, a rise of 23 seconds from the previous year.
- Dwelling fires: Rose to 8 minutes, with variations based on dwelling types.
- Other building fires: Increased to 8 minutes and 56 seconds.
- Road vehicle fires: Reached 10 minutes, a 12-second increase from the previous year.
- Primary outdoor fires: Showed the most significant increase to 12 minutes and 29 seconds.
- Secondary fires: Increased to 9 minutes and 47 seconds.
Breakdown of response time components
Response time components showed varied trends:
- Call handling time for primary fires increased by 5 seconds to 1 minute and 26 seconds.
- Crew turnout time for primary fires decreased slightly to 1 minute and 33 seconds.
- Drive time showed the largest increase among the components, rising to 6 minutes and 14 seconds.
Geographical disparities in response times
Metropolitan Fire and Rescue Authorities (FRAs) reported the quickest response times, although they too saw an increase.
Predominantly rural areas showed longer response times.
The increase in incidents during the hot, dry summer of 2022 likely contributed to these trends.
IFSJ Comment
The rise in response times across various fire categories and geographical areas presents a critical concern for public safety and emergency service effectiveness.
The trend is not isolated to a specific type of fire or location, indicating broader challenges faced by the fire and rescue services.
Factors such as increased urban sprawl, changing traffic patterns, and perhaps policy changes in fire services might be contributing to this trend.
It is essential for stakeholders to address these issues to ensure timely and effective responses to fire emergencies.

